This update contains the following key quantitative metrics from the
dashboard that are inputs to its investment decisions:Global Liquidity Index vs ₿itcoin
Market Cap 'Flippening' Tracker (₿ Ξ vs TradFi Assets)
Total Crypto Market Cap Logarithmic Trend [Aug 2023]
₿itcoin
Network Value Model
Logarithmic & Linear Regression Models [Aug 2023]
Logarithmic Trend Channel [Aug 2023]
Market State
Ξthereum
Network Value Model
Logarithmic Trend Channel [Aug 2023]
Market State
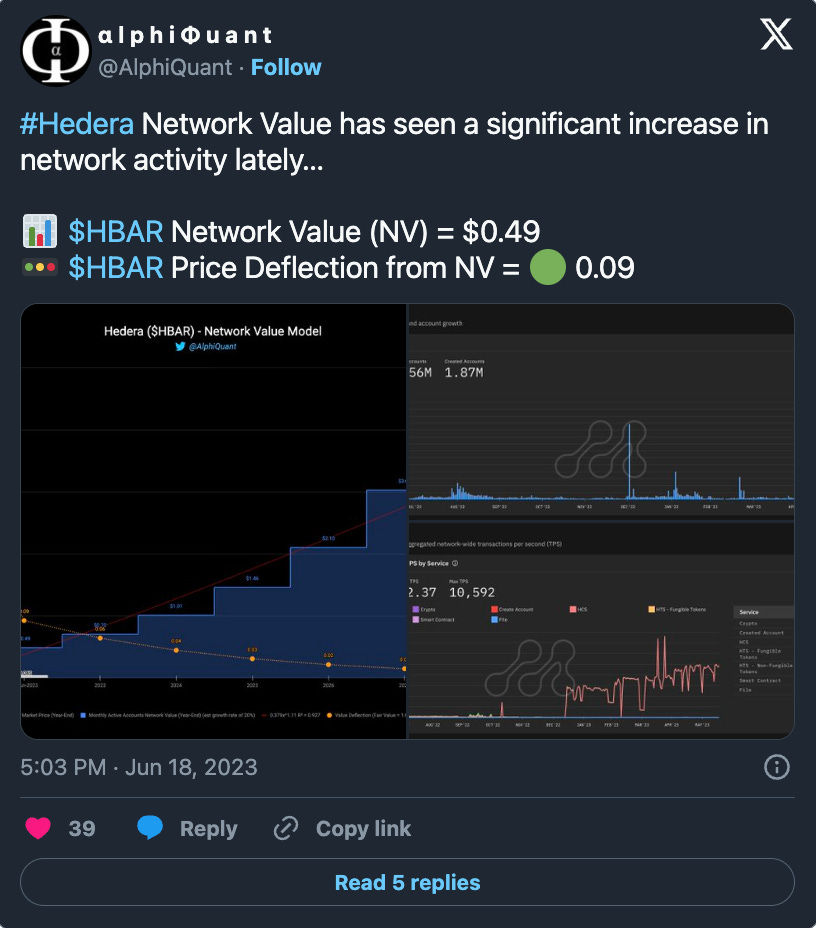
ℏedera Network Value Model
TESLA TSLA 0.00%↑
Network Value Model
Logarithmic Trend Channel [Aug 2023]
Market State
Apple AAPL 0.00%↑
Network Value Model
Logarithmic Trend Channel [Aug 2023]
Market State
Note: This issue is best viewed on Substack instead of email. Click on the charts for the HD versions.
Global Liquidity Index vs $BTC
Global Liquidity Index correlations are similar for $SPX $NDX
Global Liquidity potentially double bottoming
Perhaps a bearish divergence dip before parabolic rally in Technology and Digital Assets
ISM below 50; US manufacturing slowing; possible recession
Click above chart for details
Zooming in via chart below:
Q4 2022 - Bullish Divergence
2023 - Bearish Divergence
tal Crypto Market Cap Logarithmic Trend [Aug 2023]
₿itcoin
₿ Network Value Model (BTCUSD $23,379)
🚥
Deflection (P/NV) = 🔴 1.11 (Fair Value = 1.00)
₿ Logarithmic Regression Model [Aug 2023]
₿ Linear Regression Model [Aug 2023]
₿ Logarithmic Trend [Aug 2023]
₿ Market State
Ξthereum
Ξ Network Value Model (ETHUSD $629)
🚥
Deflection (P/NV) = 🔴 2.60 (Fair Value = 1.00)🥩 Close to 1/4 of $ETH supply is now staked (~ $50 billion) via over 900K validators.
Ξ Logarithmic Trend {Aug 2023]
Ξ Market State
ℏedera Network Value Model (HBARUSD $0.22)
🚥
Deflection (P/NV) = 🟢 0.23 (Fair Value = 1.00)
Note that ℏedera is an altcoin and challenging to model from a data science perspective. The monthly active accounts varies considerably from month to month and hence its NV fluctuates accordingly.
Overall, the expectation is for the NV model to be directionally correct and, during a euphoric market phase, $HBAR to trade at a multiple premium to its NV based on the project’s fundamentals, utility, and narrative.
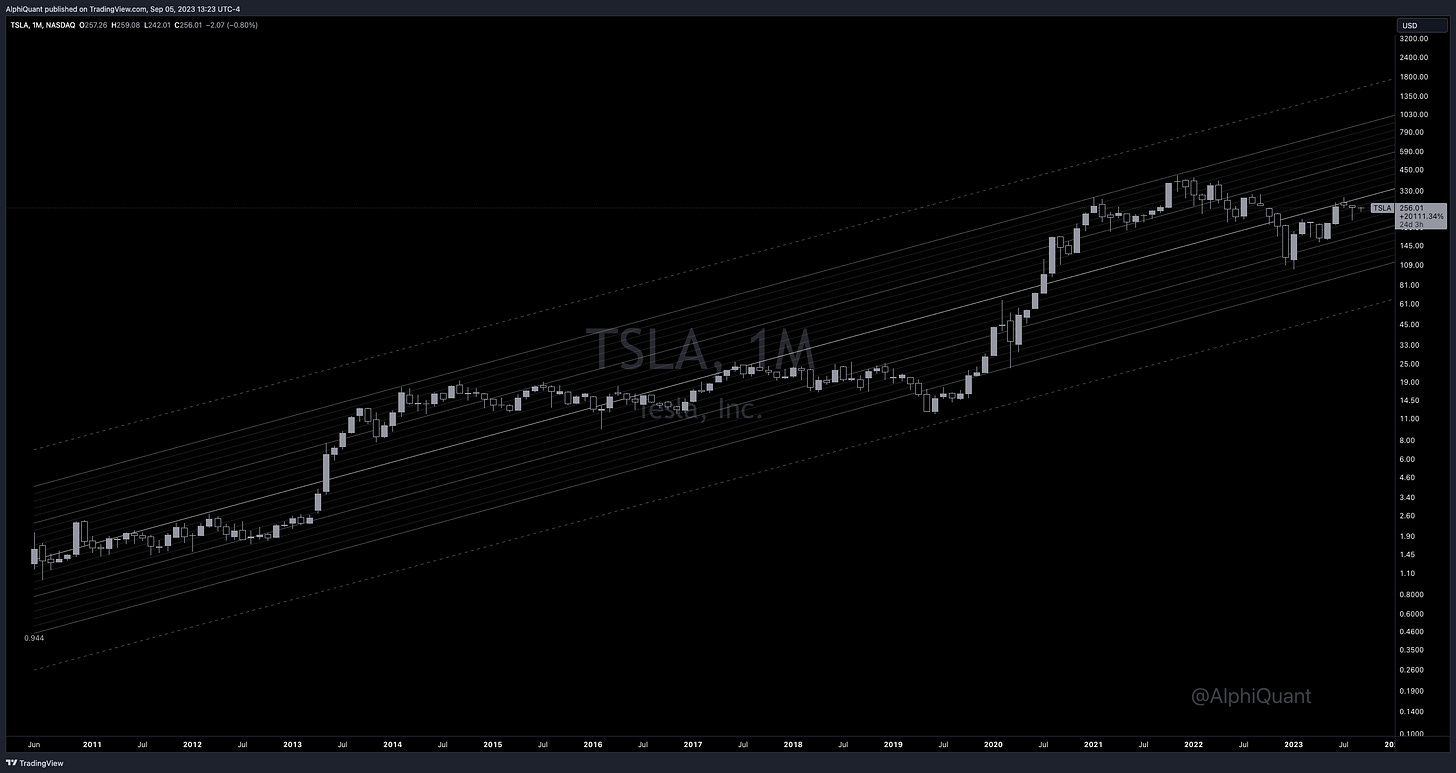
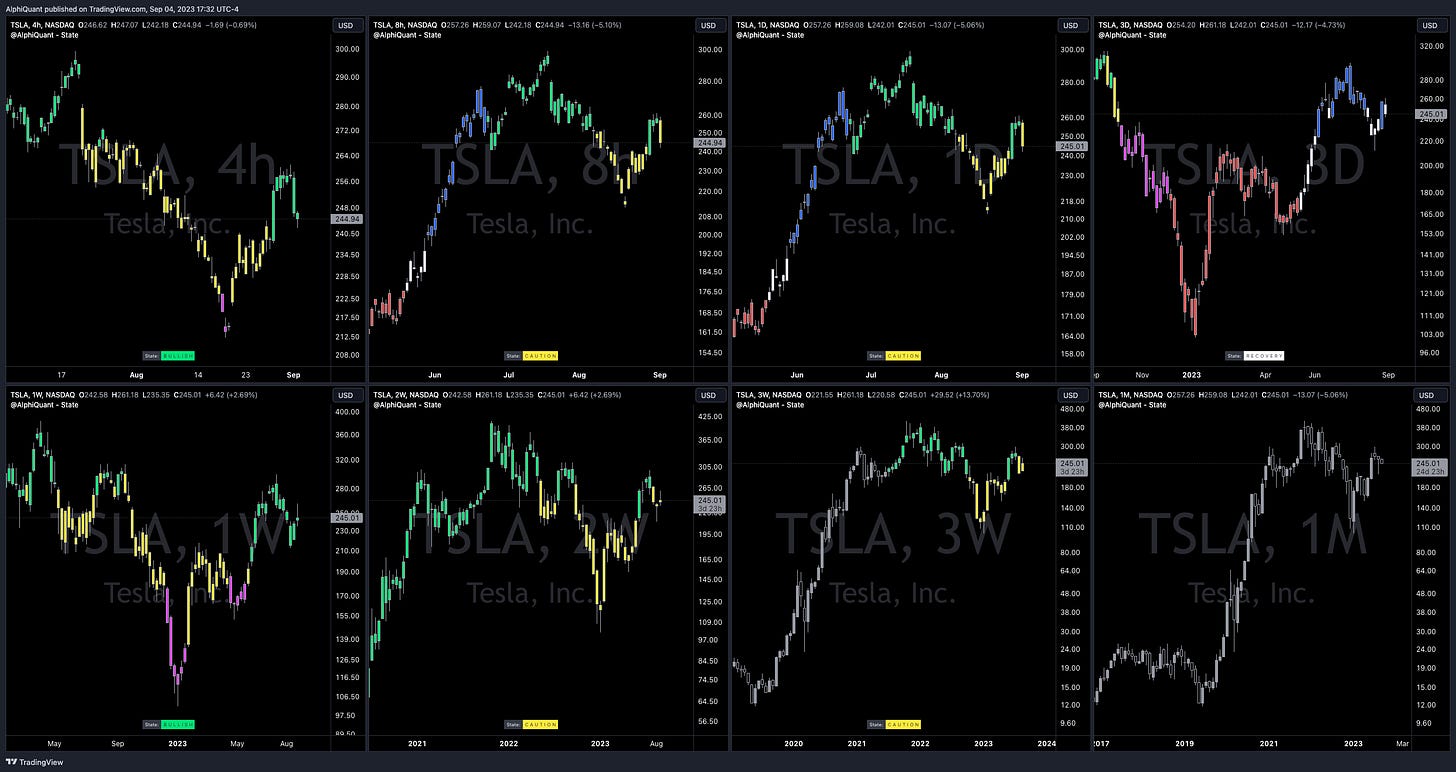
TESLA TSLA 0.00%↑
$TSLA Network Value Model ($728 per share)
📊
Ratio (EV/NV) = 0.29🚥
Deflection (P/NV) = 🟢 0.34 (Fair Value = 1.00)🔌 Enterprise Value per Supercharger = $14 million
💰 Potential ~ 8x ROI by end of 2026
$TSLA Logarithmic Trend [Aug 2023]
$TSLA Market State
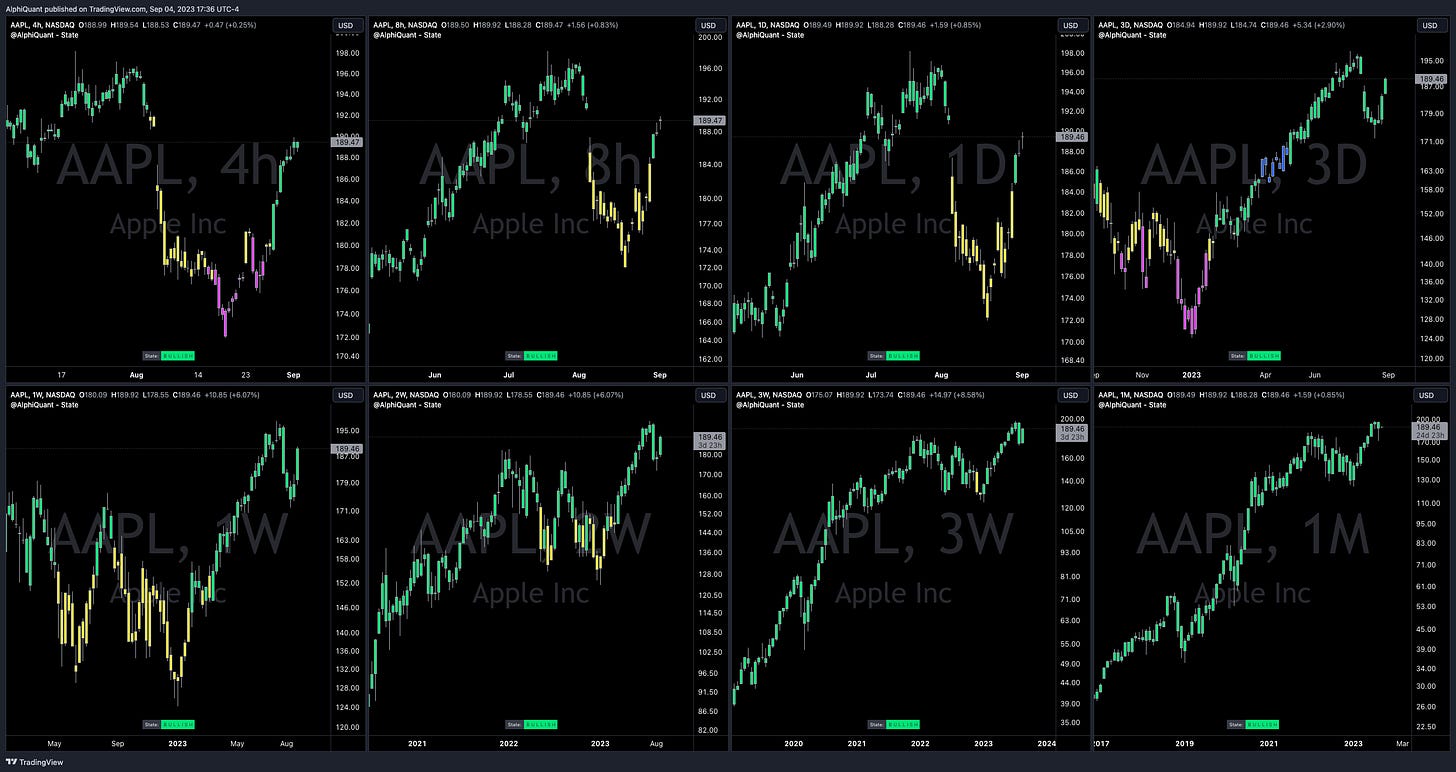
Apple AAPL 0.00%↑
$AAPL Network Value Model ($238 per share)
📊
Ratio (EV/NV) = 0.74🚥
Deflection (P/NV) = 🟡 0.79 (Fair Value = 1.00)📱 Enterprise Value per Active iPhone = $2,029
💰 Potential ~ 2x ROI by end of 2026
$AAPL Logarithmic Trend [Aug 2023]
$AAPL Market State
Disclaimer
*** AlphiQuant publishes its research & analysis for purely educational purposes and is not licensed to provide financial advice nor is it registered with any financial regulatory body. Perform your own research and consult your financial advisor for investment advice. ***


