

Table of Contents
🚧 Work in progress…
Investment Approach
Investor Profile
Investment Objective
Modus Operandi
Investment Strategy
Investment Philosophy
Quantitative Investing
Investment System
AlphiQuant Terminal
AlphiQuant Indicator Panel
Data Science Model
Quantitative Analysis
Technical Analysis
Capital Allocation Strategy
Risk Management
Subscription Service
Free Discord Pilot (coming soon)
Disclaimer

Investment Approach
Investor Profile
The AlphiQuant Terminal is a Quantitative Investing & Algorithmic Trading educational resource geared towards HNW investors, family offices, private investment groups, and sophisticated investors with a similar mindset. These types of investors understand the importance of capital allocation and risk management strategies.
Investment Objective
The quant based system employs a strategic approach prioritizing low time preference and focuses on patiently building long term wealth. The system helps establish long term investment positions buy buying at opportune times while simultaneously position trading the same assets in attempts to capture significant price increases and avoid large drawdowns. Breakout trades are also executed when high probability opportunities present themselves.
Modus Operandi
Quantitative investing with laser focus on Ξxponential growth in the digital age ₿ased on financial data science attributed to network effects (NfX).
📐 Investing Edge Trifecta = Fundamental + Technical + Quantitative Analysis
🕵️♂️ Investigate Sector/Company/Asset
🔬 Research Technology & NfX
🧮 Calculate Data Science Model
💯 3C’s Confidence/Conviction/Congruence in Math
💹 Analyze Charts & Indicators
🧠 Structured Decision Making
😐 Stoic Trade Execution
🧐 Maintain Laser Focus
🏦 Employ Risk Management Principles (Asymmetric Risk/Reward Profile; Capital Preservation)
💼 Concentrate Portfolio
🎯 Rule of 72 @ 36% (actually 41%) CAGR = 2 years to double money
Note: These are characteristics of successful quantitative UHNW investors.
Few investments.
Asymmetric investments.
Concentrated investments.
Infrequent investments.
Investment Strategy
Investment Philosophy
Combining Fundamental, Technical, and Quantitative analysis is an investing edge trifecta. AlphiQuant performs fundamental analysis to develop a thesis regarding the asset and then relies upon an emotionless mathematical system that is comprised of technical and quantitative metrics. Price action is paramount and the system is implemented with conviction, discipline, and an unbiased perspective.
Quantitative Investing
Quant investing utilizes data, information, and mathematical models to develop a structured rules-based decision making process. This method helps remove the emotional aspect of investing by trusting the math leading to minimizing losses and maximizing profits.
Investment System
This quant based system consists of a proprietary suite of technical indicators and financial data science models. Together, they help identify the following based on high timeframe setups:
Trends and Reversals
Momentum
State of Asset
Stage Analysis
Breakouts via volatility contraction patterns (VCP)
Position trading entries and exits
Opportunistic value investments focused on technology assets that exhibit network effects
AlphiQuant Terminal
The AlphiQuant Terminal is comprised of various proprietary modules including indicators, dashboards, heatmaps, quantitative & technical analysis, and alert bots that guide @AlphiQuant's investment decisions.
"Focus on signal and eliminate noise."
The Terminal employs mathematical models & statistical methods in the design and execution of its investment system.
It is comprised of the following custom modules:
Discord Server
Indicator Panel
Bots for Investment Signals + Newswire
Dashboards
Quantitative Analysis
Technical Analysis
AlphiQuant Indicator Panel
The Terminal’s core engine is the proprietary 'Indicator Panel' that generates automated signals and notifications.
The proprietary Indicator Panel analyzes price action of assets through a mathematical lens with an emphasis on a long term investment time horizon.
The Indicator Panel provides primary & confluent signals along with supporting technical & risk metrics designed to provide insight into potential trend reversals and associated entry & exit points concentrating on capturing large market moves.
The chart’s Japanese style candlesticks are coloured as per the legend at the bottom of the Indicator Panel table. While green candles signify a bullish posture, “BUY” signals only appear on high probability setups.
For all signals and indicators, higher timeframe analysis statistically yields greater accuracy.
The higher timeframes, particularly the 1-week & 3-day, are a good gauge for taking action for more conservative high probability investors.
Lower timeframes can provide insight to potential trend reversals for the more aggressive investor, but requires appropriate position sizing and risk management.


Example of a BUY signal on Gold:

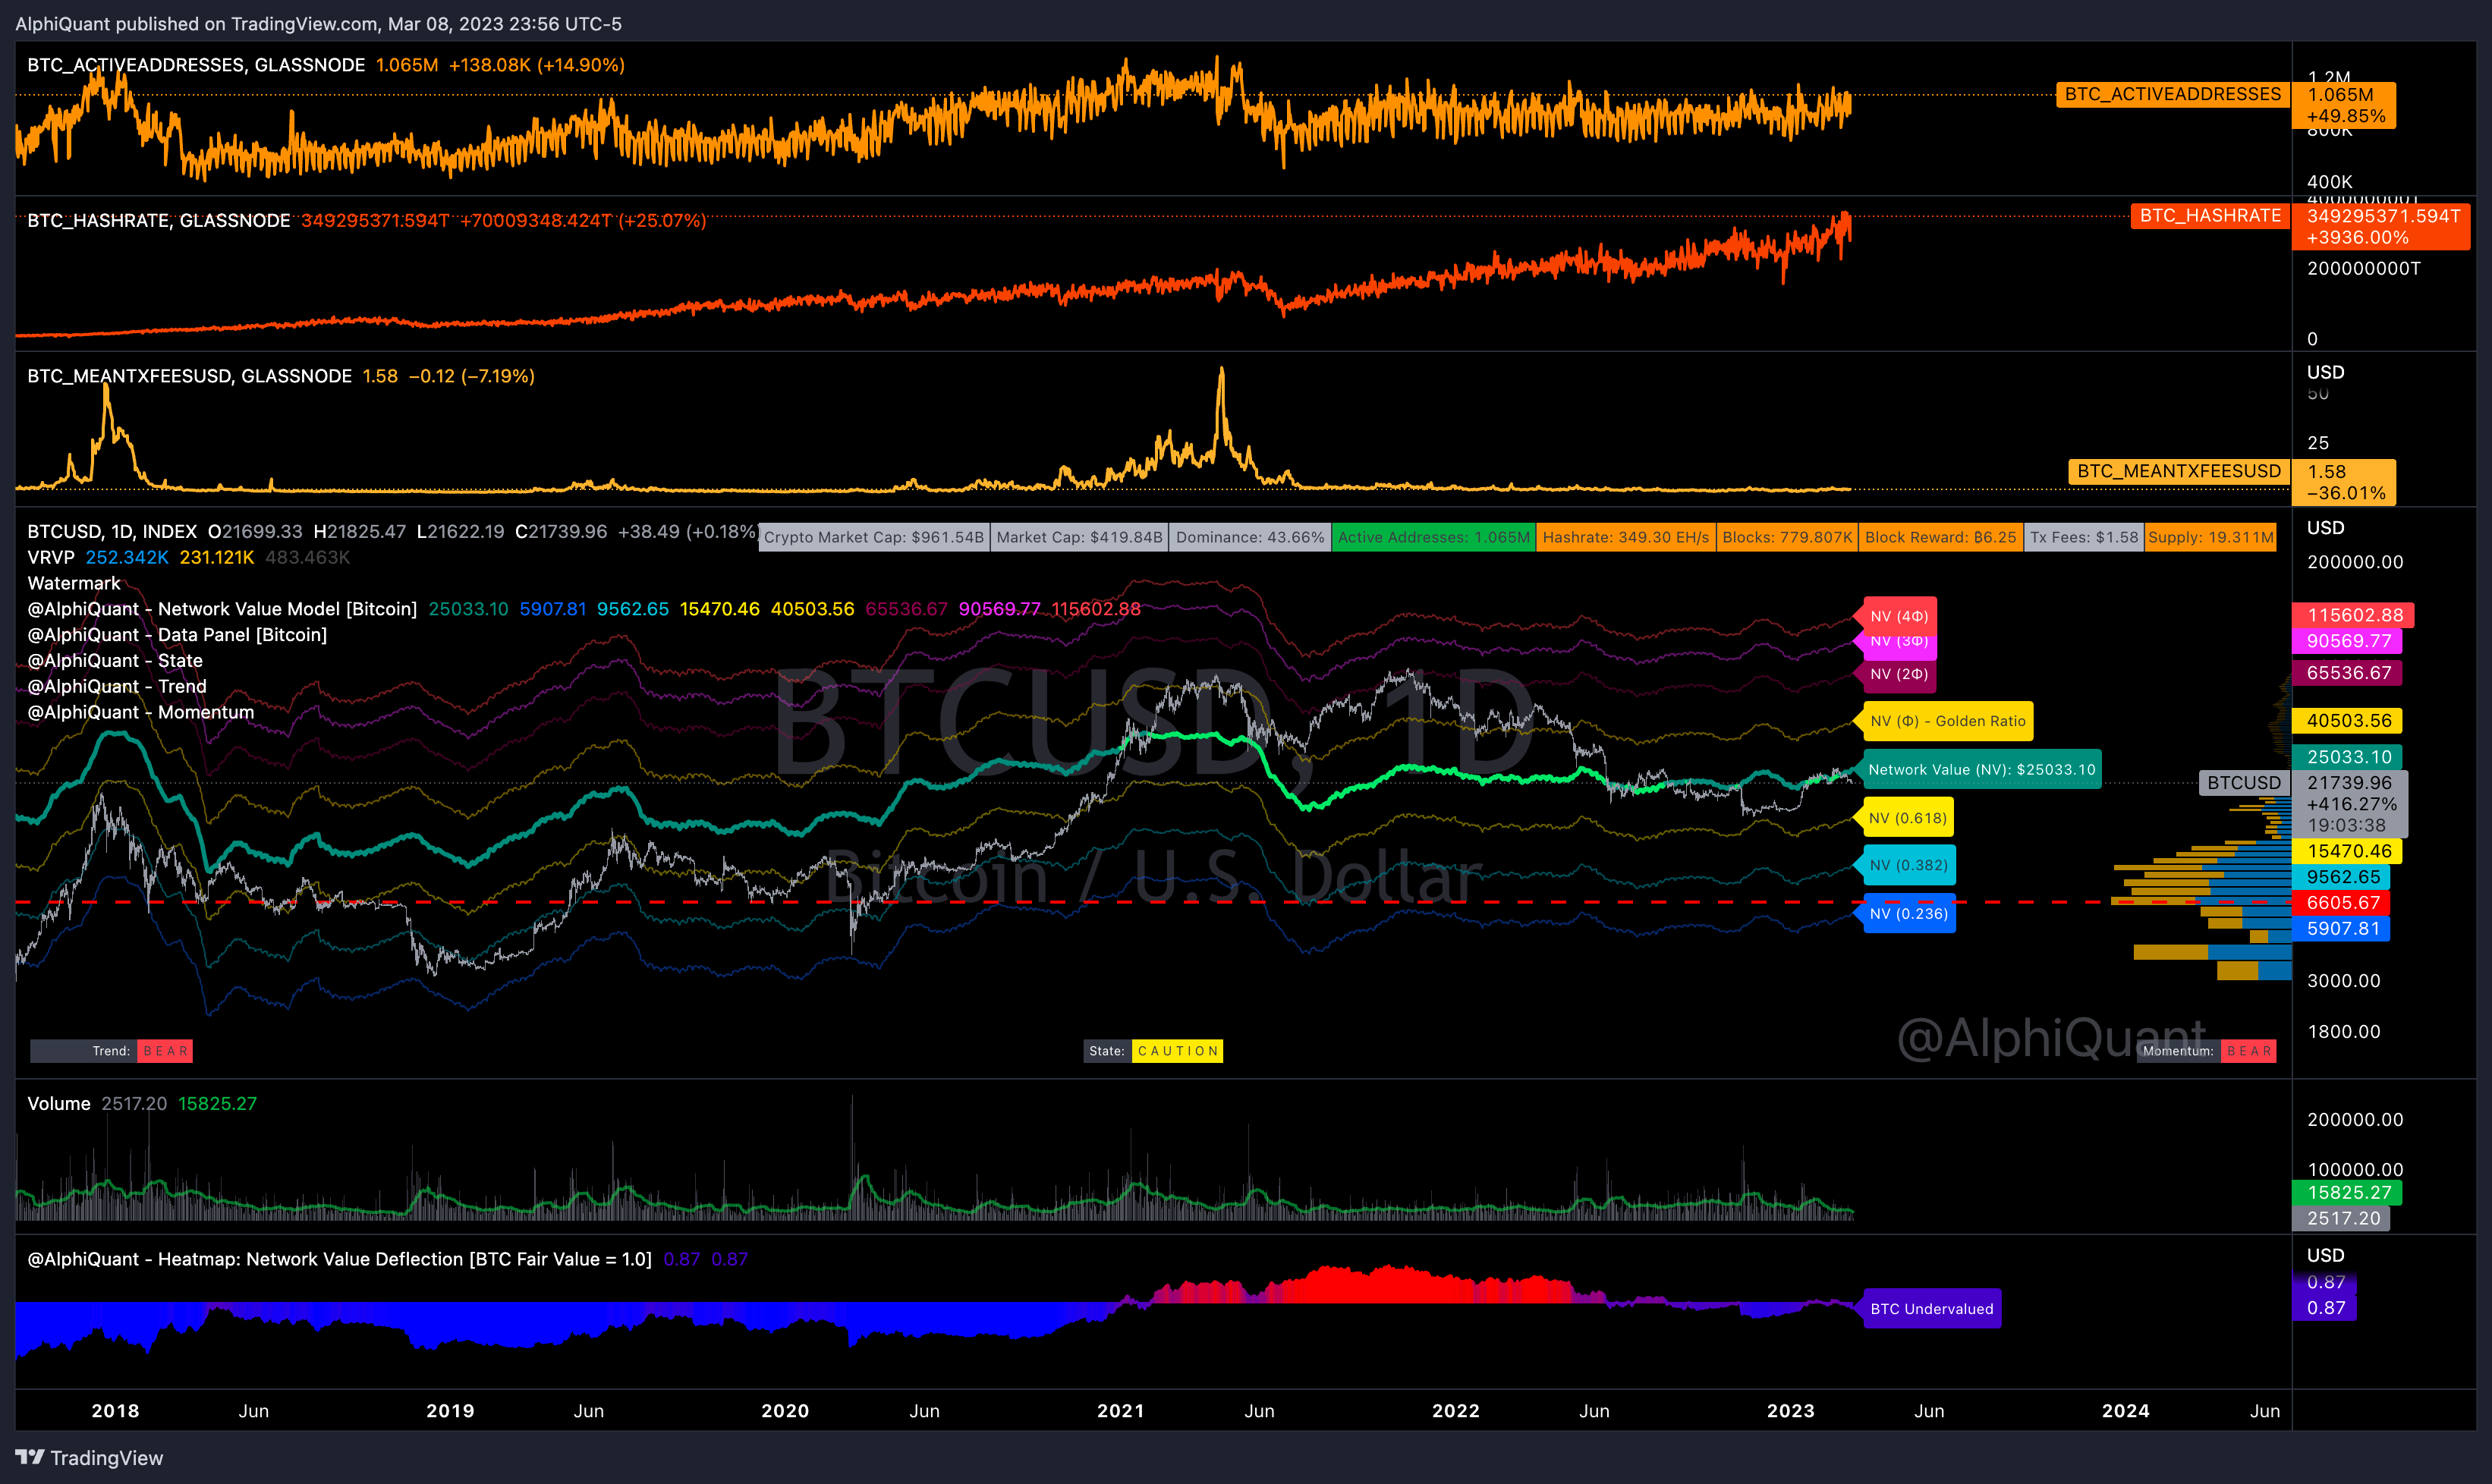
Data Science Model (Technology Assets)
The quantitative financial data science model is primarily based upon Metcalfe’s Law (network effects) along with other mathematical principles related to exponential growth and on-chain data from glassnode. The network value quant model identifies potentially opportunistic moments to increase long term core investment positions during bull markets and potentially asymmetric investment opportunities during bear markets.

Examples of technology based assets that exhibit network effects:

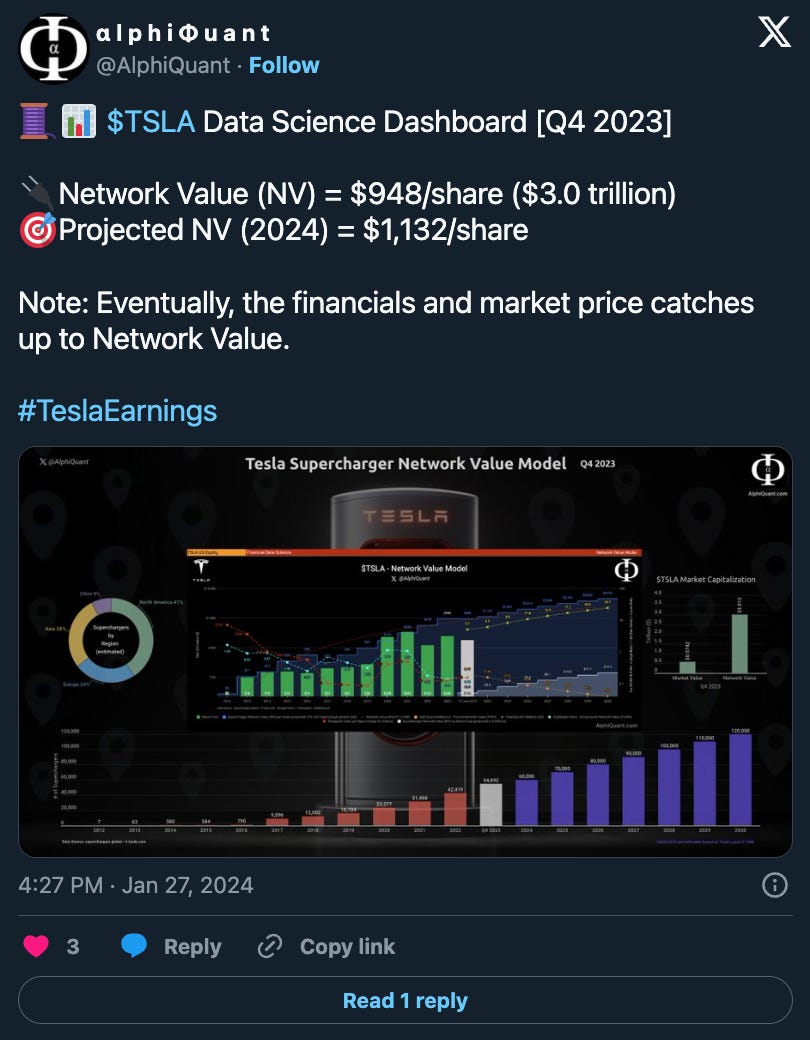


Over the long haul, for assets that exhibit network effects (especially technology related), the valuation models based on data science tend to lead the ones based on traditional finance. These types of valuation models are most useful in bear markets for determining undervalued opportunities.

Quantitative Analysis
Example of Bitcoin Linear Regression Model (e.g. Log-Log plot; Power Law)


Technical Analysis
Classical charting technical analysis techniques supplement the quant system identifying simple, yet elegant, setups that yield the most accurate results based on probabilities and statistics.


Note: The quantitative investment system is implemented in the spot markets avoiding margin, debt, leverage, derivatives, and financially engineered products of any kind.
Capital Allocation Strategy
AlphiQuant manages a concentrated investment portfolio. A core investment position comprising of a few assets is established and held for long term capital appreciation. Simultaneously, these same assets are position traded on a high timeframe basis. Other assets are also opportunistically traded in anticipation of breakouts leveraging stage analysis and VCP setups.
For assets with potential for exponential growth, asymmetric risk/reward, and high volatility (i.e. high α with high β), the following capital allocation profile is established:

Risk Management
The number of assets and portfolio ratio of investment to trading is the discretion of the money manager whose risk profile will differ based upon their investing style and parameters.
Subscription Service
AlphiQuant Terminal is working on releasing a subscription service via Discord with the following features:
Automated Alerts & Notifications based on Indicator Panel:
Investing & Trading signals
Dashboards
Heatmaps
Technical & Quantitative Analysis
Newswire Bot
Subscribe to be notified of free Discord pilot release…
Disclaimer
*** AlphiQuant publishes its research & analysis for purely educational purposes and is not licensed to provide financial advice nor is it registered with any financial regulatory body. Perform your own research and consult your financial advisor for investment advice. ***
Why subscribe?
Every new edition of the Dashboard goes directly to your inbox.
Be notified when the free Discord pilot goes live.
